Note
Go to the end to download the full example code.
Function Space Examples#
This example demonstrates how to create and visualize different function spaces.
import numpy as np
from fdg import BasisSpecs, FunctionSpace
from matplotlib import pyplot as plt
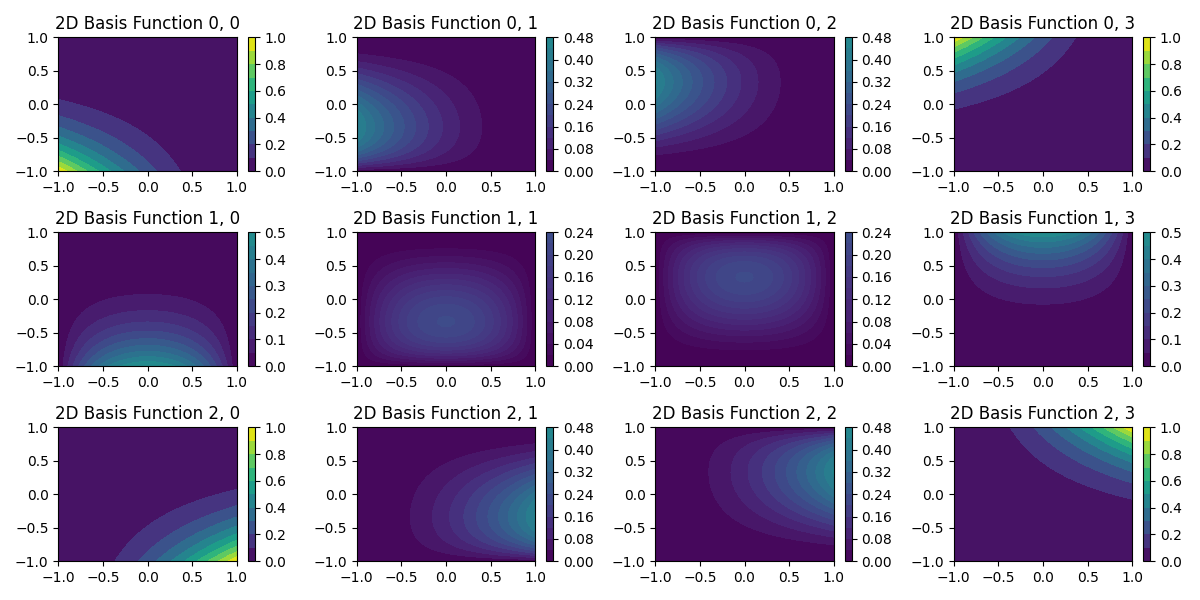
2D Function Space Example#
This example creates a 2D function space using Bernstein basis functions of degrees 2 and 3, then plots the basis functions over a grid.
x, y = np.meshgrid(np.linspace(-1, 1, 51), np.linspace(-1, 1, 51))


space_2d = FunctionSpace(
    BasisSpecs("bernstein", 2),
    BasisSpecs("bernstein", 3),
)
bv = space_2d.evaluate(x, y)
assert np.allclose((np.sum(bv, axis=(-2, -1))), 1.0)  # Should be all ones

orders = space_2d.orders
fig_2d, axes_2d = plt.subplots(orders[0] + 1, orders[1] + 1, figsize=(12, 6))

for i in range(orders[0] + 1):
    for j in range(orders[1] + 1):
        ax = axes_2d[i, j]
        c = ax.contourf(x, y, bv[:, :, i, j], levels=11, cmap="viridis", vmin=0, vmax=1)
        fig_2d.colorbar(c, ax=ax)
        ax.set_title(f"2D Basis Function {i}, {j}")

fig_2d.tight_layout()
plt.show()
Total running time of the script: (0 minutes 1.176 seconds)